Design charts and infographics effortlessly
A premium Figma toolkit crafted for building dynamic charts, dashboards, and infographics with precision and style.
infography
25
Graph & Charts
35+
Type
2
Categories
All Your Data Visualizations, Unified
Create any type of chart or infographic effortlessly — perfect for dashboards, reports, or presentations.
From simple metrics to complex heat maps, everything you need is right here.
Line Graph
48 variants
Donut Chart
14 variants
Pie Chart
14 variants
Bar Chart (Vertical)
8 variants
Bar Chart (Horizontal)
16 variants
Heat Map
3 variants
Metric
6 variants
Street
3 variants
World Map
16 variants
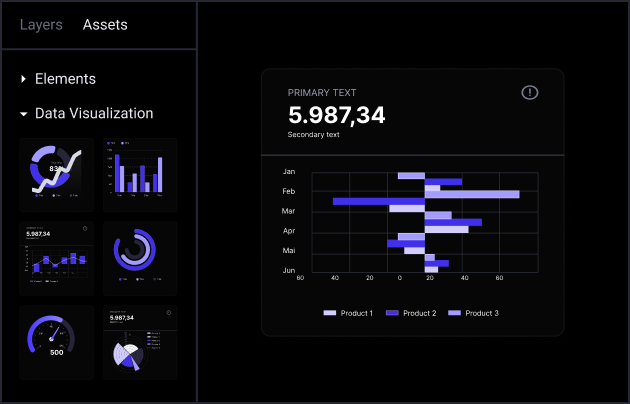
Step 01
Drag & Drop with Ease
Simply pick any element from the “Assets” panel and drop it into your workspace. It’s that simple to start building your layout visually — no coding needed.
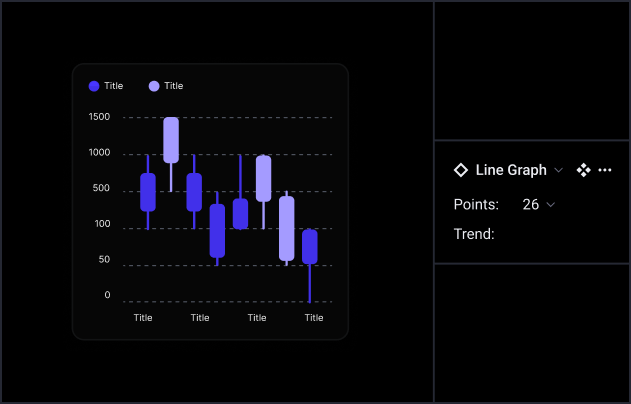
Step 02
Customize Freely
Adjust every instance just the way you want — tweak visuals, layouts, or content to fit your goals perfectly.
For example, switch between chart types, update colors, or fine-tune data labels instantly.
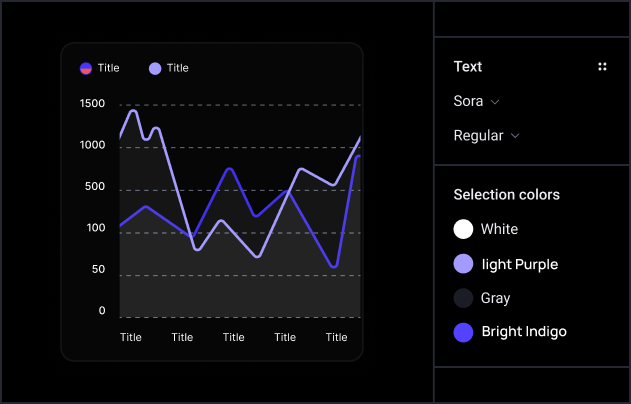
Step 03
Quick color and font changes
Use the preset styles or define your own to match your brand. Update fonts, palettes, or themes with just a few clicks.
Licenses
Get Universal Data Visualization
Projects require different types of licenses. Choose your one.
Custom service
Custom Figma Data Visualization based on the Universal Data Visualization.
$59 $9
- 25+ Inforgraphy
- Light & Dark Mode
- Full Editable graphs
- Use in Personal or commercial projects
- Free 35+ Graph and Charts design
- Safety payments provided by Lemon Squeezy.
5.0

5.0
Turn Your Data Into Stunning Visuals
Universal Design System is a powerful tool for creating Web/Mobile And Dashboard Web App in Figma.


Trusted by over 800 designers
Info
Version
v1.1
Platform
Web & Product Design
Tools Supported
Figma
Features
Updates
Version 1.0 (Jan 1 2026)
Added essential chart components & layouts
View all updates →
FAQs
Need help?
Here are answers to our most frequently asked questions.
What is Universal Data Visualization?
Universal Data Visualization is a system that helps you transform complex data into clear, interactive, and easy-to-understand visuals such as charts, graphs, and dashboards—usable across products, platforms, and teams.
How do I access updates after purchasing?
Once you purchase, all updates are automatically available in your account. You can download the latest versions anytime from your dashboard.
Does it support real-time or live data?
Yes. Visualizations can be designed to work with real-time or frequently updated data, depending on your data source and integration setup.
Is the payment method secure?
Yes, all payments are processed through secure and trusted payment gateways. We do not store your card or payment details.
Can developers easily implement these visualizations?
Yes. The visualization components are developer-friendly, well-structured, and easy to integrate into web or app products with clean handoff and documentation.
Can I upgrade to the Universal Design System?
Yes, you can upgrade anytime to the Universal Design System to access a complete and scalable design framework for all your projects.
Can I use your products for commercial projects?
Yes, all our products can be used for personal and commercial projects, including client work.
Do you offer a education discount?
Yes, we offer special discounts for students and educators. Please contact us with valid proof to receive the discount.
What should I do if I don't get a response?
If you don’t hear back within 48 hours, please check your spam folder or contact us again through our website. We’ll make sure to assist you as soon as possible.